
© Lukas Klein
© Lukas Klein

© Lukas Klein

© Lukas Klein

© Lukas Klein
© Lukas Klein
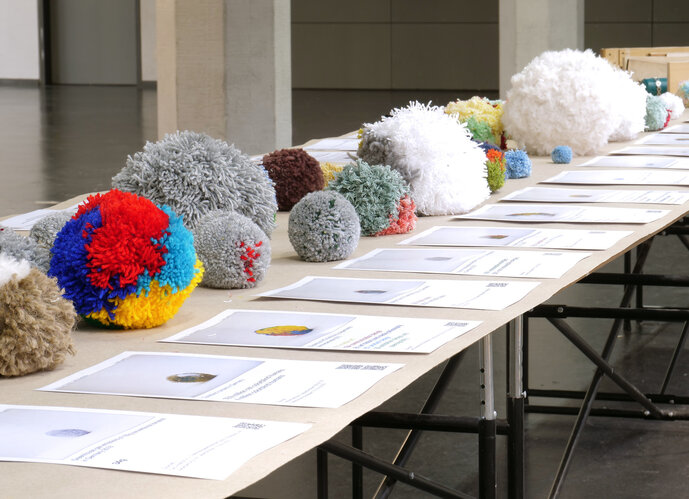
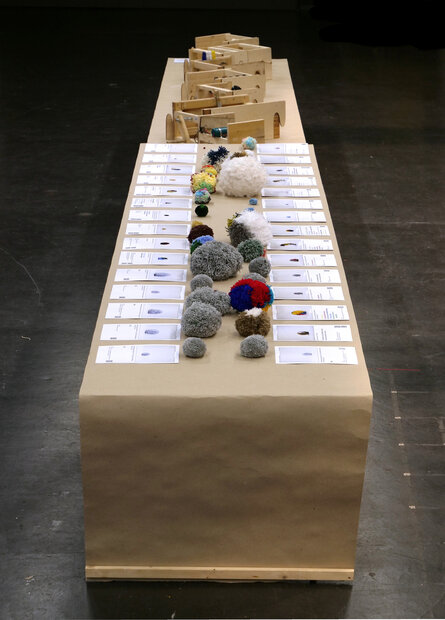
The Pompom World - Data Visualization shows different data sets in physically tangible objects: Pompoms.
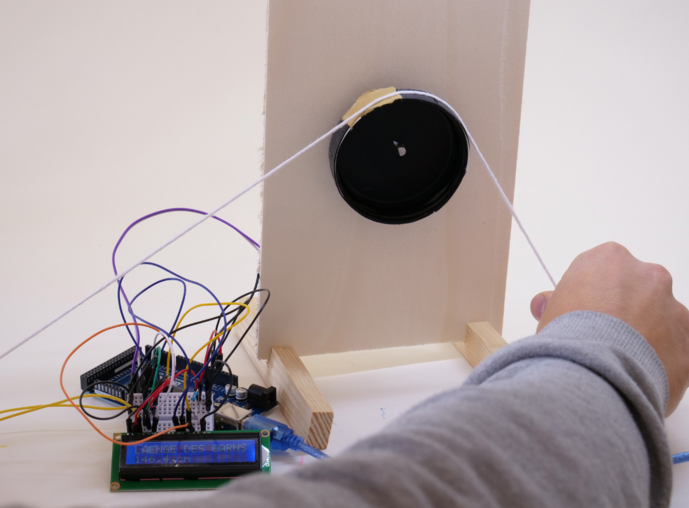
Quantities, proportions and ratios of the data are thus very vivid and pleasant to experience. Each data set is represented with tons in grams, making all pompoms a total picture, as they are connected by their weight. A modular machine allows semi-industrial production of the pompoms with length measurement, two color stations, a drying station, a winding station and an unwinding station. This project questions the way we interact, present and deal with data in an increasingly digital world and what an object can or must depict.
Supervision: Prof. Chris Kabel, Prof. Mario Minale